

Analytics & Reports
Where it is: Home → Your apps → Analytics (at the top of the screen the module shows up as Analytics & Reports)
Address: /app/modulos/analytics-bi
What it's for
You invest in ads, answer the phone, reply on WhatsApp. At the end of the month comes the question nobody can answer properly: was it worth it? How many people came in, how much each one cost, how many turned into actual jobs. Usually the answer is "I think so" — and "I think so" doesn't pay the bills.
Analytics & Reports is the dashboard that puts all of that on a single screen. It doesn't ask you to type anything: the numbers come on their own from what's already happening in your account — the leads that came in, the money spent on ads, the visits to your website, the fake clicks the system blocked. You choose whether you want to see the last 7, 30 or 90 days and read the result.
The one who explains those numbers to you is Nina, the module's specialist. She chats with you right next to the screen and writes reports in plain running text, the way you'd tell a business partner. Working alongside her is Atlas, who researches your market and tells you whether your cost per lead is high or low compared to your competitors.
Everyday example: you're a locksmith and you run ads on Google. You open the Home tab, click 30 days and see: 48 leads in the period, 31 by phone call and 17 by WhatsApp, with a cost per lead of $22.40. You also see that 68% of those leads were good, and that the system blocked 210 fake clicks. Then you ask Nina, in the chat next to it, "what changed compared to last month?" — and she answers you in English.
Before you start
- The Analytics & Reports module has to be active on your account. If it isn't, the screen shows the module's name and the message that it's part of a product you haven't subscribed to yet.
- The first time you open a newly purchased module, an invitation appears at the top of the page to set it up by chatting with Nina: "It's optional — the tabs below already work. Each reply from the specialist uses AI credits." Chat with Nina lets her get to know your company; Dismiss removes the invitation without chatting. If you open the chat, the Complete setup button at the end of it also removes the invitation.
- Nothing to fill in. Unlike the other modules, here you don't register any data. The numbers come from what's already happening in your account.
- To see the Investment block (spend, budget, cost per lead) you need to have Google Ads connected to your account. Without it those fields show as a dash (—), not as zero.
- To see the Site traffic block you need to have Google Analytics and/or Google Search Console connected. Without them the whole block simply doesn't show up.
- Optional, but recommended: fill in the Target contacts/day on the Settings tab. Without a target, Nina doesn't know what a good result is for you.
First steps
- On Home, under Your apps, click Analytics. You land on the Home tab.
- If Nina's invitation shows up, you can accept (Chat with Nina) or click Dismiss — the dashboard already works either way.
- On the Home tab, choose the period at the top: 7 days, 30 days or 90 days. It starts at 30.
- Read the numbers from top to bottom. While the system is fetching, three little dots (…) appear in place of the number — that means "I'm still counting", not "zero".
- Go to the Settings tab and write your Target contacts/day. How many quote requests per day would make you happy? Write that number and click Save.
- Go back to the Home tab and use the chat on the right side (Talk to the specialist) to ask Nina what she's seeing.
- Go to the Reports tab and click Generate report now to get your first written report. After that Nina sends you one every Monday by email, and it also stays saved in that tab.
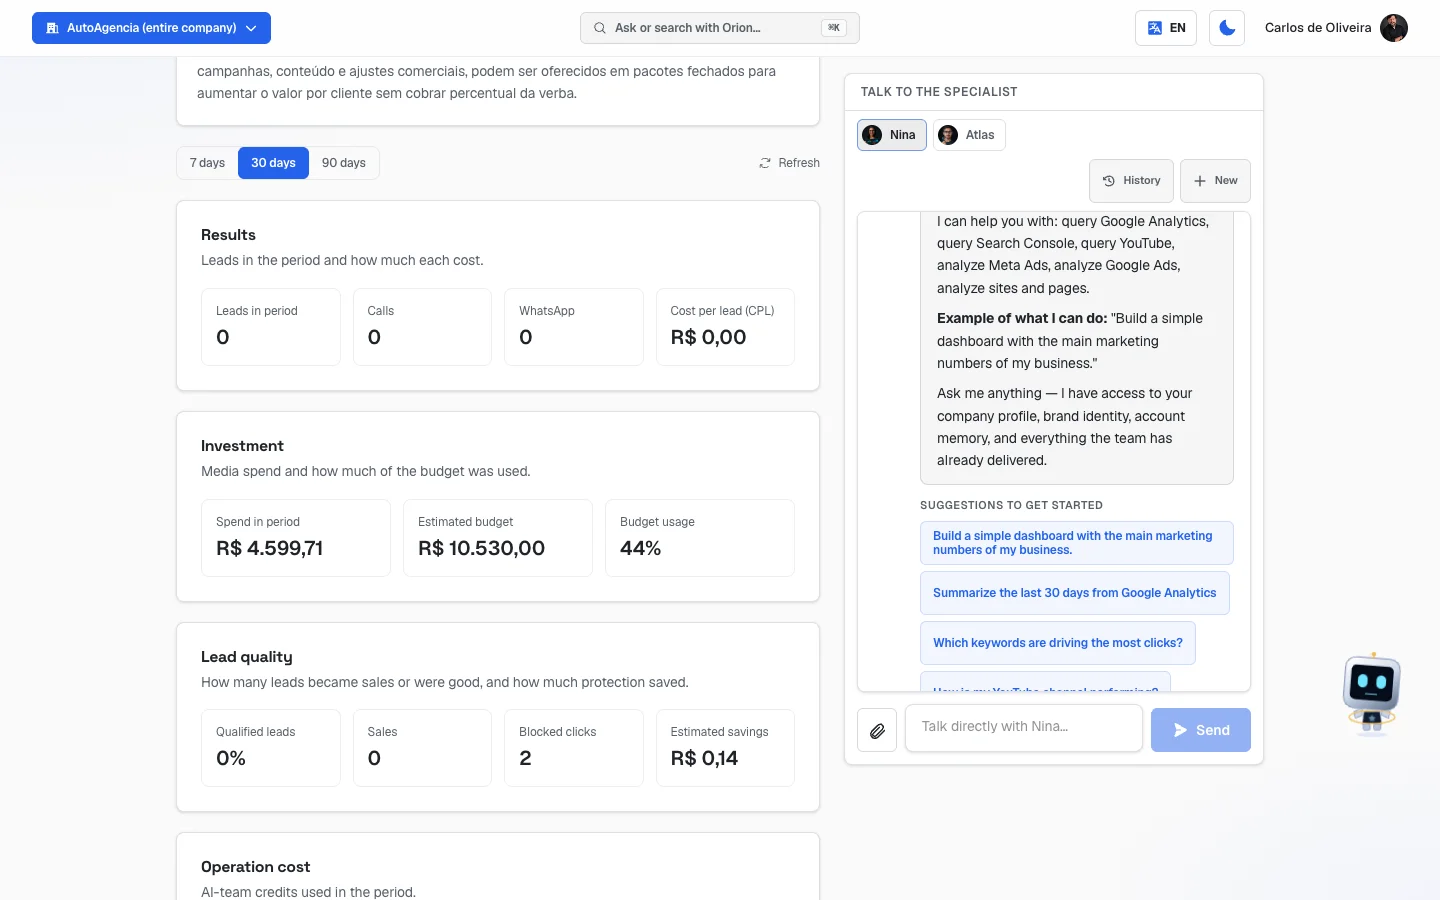 Home tab with the period selector (7/30/90 days) and the Results and Investment blocks
The tabs, one by one
Home
/app/modulos/analytics-bi/inicio
It's the main screen. On the left side are the numbers; on the right side is the Talk to the specialist chat, where you talk to Nina and to Atlas (on a computer they sit side by side; on mobile the chat shows up below).
- What you see here:
- At the top, the module's panel: a note from Nina saying how your operation is doing, and three numbers — Reports saved, Competitors mapped and Daily contact goal.
- The period buttons: 7 days, 30 days, 90 days.
- A Refresh link in the right corner, to force a new fetch.
- The number blocks, explained in the "How to read the numbers" section below.
- What you can do: change the period, refresh the numbers and talk to Nina and Atlas in the chat next to it.
The blocks that show up:
| Block | What it answers |
|---|---|
| Results | How many leads came in and how much each one cost. |
| Investment | How much was invested in ads and how much of the budget was used. |
| Lead quality | How many leads were any good and how much the protection saved. |
| Operation cost | How many credits your AI team used. |
| Site traffic & organic Google | How many people visit your website and where they come from. Only shows up if Google Analytics or Search Console is connected. |
| Market research (Atlas) | How your cost compares to your industry's. Only shows up after Atlas does the research. |
When the system can't read a source, it shows a dash (—) in place of the number, not zero. If Google Ads doesn't respond, a yellow notice appears: "I could not read Google Ads right now, so media figures for this period are blank instead of showing as zero." That's on purpose: $0.00 in a month when you really spent money is worse than an empty field.
If the whole screen fails, a red box appears: "I could not load the numbers right now." with the explanation that it's a system failure, not an absence of results, and a Try again button.
Reports
/app/modulos/analytics-bi/relatorios
- What you see here: the list of reports written by Nina, from newest to oldest. Each one shows the date it was generated and the summary text. The first one on the list comes marked as Latest report.
- What you can do: generate a report now, outside the weekly routine.
- How it works on its own: Nina emails the report every Monday, and the copy is saved here. You don't need to ask for it.
Step by step — generating a report off-schedule:
- On the Reports tab, click Generate report now.
- While it's being written, the button turns into Generating….
- When it finishes, a notice with the result appears and the report enters at the top of the list.
Generating a report outside the routine uses credits — the screen itself says so. The weekly Monday report is already included.
If you click several times in a row, the system answers: "You requested the report several times in a row. Wait a few moments and try again — today's report is already being prepared." It's not an error: it's so you aren't charged twice for the same thing.
- Empty state: if you've never generated any, "No report generated yet" shows up, with the explanation that each finished report shows up there with its period and highlights, and the tip to use the Generate report now button.
Settings
/app/modulos/analytics-bi/config
This tab has only two fields. They don't change the numbers — they change Nina's read of them, on the panel and in the reports.
- What you see here: the Panel settings block, with two fields and the Save button.
- What you can do: tell Nina what your target is and what you want her to look at.
Step by step:
- On the Settings tab, fill in the Target contacts/day.
- If you like, write a Note.
- Click Save. The notice "Saved" appears.
Each field explained:
| Field | What to write |
|---|---|
| Target contacts/day | How many quote requests per day would make you happy. Just a number. It's the yardstick Nina uses to say whether the month was good or bad. While it's blank, she warns you on the panel: "Your dashboard has no goal yet — without it I can't tell what a good result is for you." |
| Note | A sentence saying what matters to you right now. The example the screen itself suggests is "Focus on qualified leads…". It's used so Nina pulls the analysis in that direction. |
How to use
/app/modulos/analytics-bi/como-usar
Every module has this tab at the end. It's the module's manual inside the system itself.
How to read the numbers
On the module's panel (the box at the top of the Home tab):
- Reports saved — how many of Nina's reports are saved here. The system keeps the most recent ones; very old reports leave the list. That's why the label says "saved", not "generated".
- Competitors mapped — how many companies Atlas has already researched in your market.
- Daily contact goal — what you wrote on the Settings tab.
Results block:
- Leads in period — how many new people came in during the chosen period. Below it, when there's something to compare with, the change in % against the previous period appears, with a green arrow (went up) or red arrow (went down).
- Calls — how many of those leads came by phone.
- WhatsApp — how many came from WhatsApp.
- Forms — how many came from a form. This number only shows up when it's greater than zero, on purpose: a permanent "0" would make you think your website doesn't convert.
- Cost per lead (CPL) — how much you paid, on average, for each person who came in. It's the most important figure on the screen: it's the ad spend divided by the number of leads.
Investment block:
- Spend in period — how much went out on ads.
- Estimated budget — how much you were expected to spend.
- Budget usage — how much of what was planned was actually used, in %.
Lead quality block:
- Qualified leads — out of every 100 classified leads, how many were a sale or were good. The ones left are the throwaways and the fraudulent ones.
- Sales — how many leads turned into an actual sale.
- Blocked clicks — how many fake or suspicious clicks the system stopped on your ads before they cost you money.
- Estimated savings — how much those blocked clicks would have cost. If the system can't read the average cost per click, the dash and the explanation appear: "We blocked the clicks, but I could not read the cost per click to estimate the savings."
Operation cost block:
- Credits used — how much your AI team worked in the period.
- Cost per contact — the same cost per lead from the Results block, repeated here so you can compare it with the cost of the operation.
Site traffic & organic Google block:
- Site visits — how many times someone opened your website.
- Visitors — how many different people. A person who came back three times counts as 3 visits and 1 visitor.
- Site conversion — out of so many visits, how many become a lead. The screen writes this in plain English below the number: "1 lead every 40 visits".
- Visits over the last N days — a slim chart showing the daily ups and downs, with a ↑ or ↓ badge comparing with the previous period.
- Traffic sources — the five biggest sources, already translated: Organic search, Paid search, Direct, Social, Referral, Email and so on.
- Google clicks — how many people clicked through to your website after seeing it in search.
- Google impressions — how many times your website was shown in search, even without a click.
- Avg. position — where on Google's list you appear, on average. The lower, the better: 3 is better than 15.
- Top search queries — what people typed into Google before landing on your website.
Market research (Atlas) block:
- Industry CPL benchmark — how much companies in your line of business usually pay per lead. Next to it your number appears, for comparison. If yours is well above, you're paying a lot; well below, you're doing well.
- Below it, the opportunities text and the list of competitors Atlas mapped.
- To update, ask Atlas in the chat.
Frequently asked questions
Do I need to fill in anything for the numbers to show up? No. This module has no registration. The numbers come on their own from what's already happening in your account. The only thing worth filling in is the Target contacts/day, on the Settings tab — and it doesn't change any number, it just helps Nina say whether the result was good.
A dash (—) showed up in place of a number. Is it zero? No. A dash means "I couldn't read that information right now". Zero means "it happened zero times". They're different things, and the system takes care not to confuse the two. Three little dots (…) mean "I'm still counting".
Why doesn't the site traffic block show up for me? Because there's no Google Analytics or Google Search Console connected to your account. Without one of those two sources the whole block disappears, instead of showing everything at zero.
What's the difference between Nina and Atlas? Nina looks inward: your numbers, your month, your target. Atlas looks outward: your market, your competitors, how much others pay per lead. The two are in the same chat, next to the Home tab.
Do I need to ask for the report every week? No. Nina emails you one every Monday, and the copy stays on the Reports tab. The Generate report now button is for when you want one off-schedule — and that one uses credits.
The cost per lead went up. What does that mean? That you're paying more for each person who comes in. It could be that the ad is more contested, that the copy is attracting the wrong people, or that fewer people are getting in touch for the same money. Ask Nina in the chat — that's exactly the kind of read she does.
When something goes wrong
| Symptom | What to check | What to do |
|---|---|---|
| The screen shows the module's name and says it's part of a product you haven't subscribed to yet | The Analytics & Reports module isn't active on your account. | Activate the module in the catalog. |
| "We couldn't verify your access right now." | It's a connection failure, not a missing contract. | Click Try again. |
| "I could not load the numbers right now." (red box) | System failure while fetching the data. It does not mean there were no results in the period. | Click Try again. If it persists, talk to Nina in the chat. |
| Yellow notice: "I could not read Google Ads right now…" | The Google Ads connection didn't respond on this fetch. | Wait a few minutes and click Refresh. If it continues, check the Google Ads connection on your account. |
| The money figures show as — | Either Google Ads didn't respond, or there's no spend data in the period. | Check the yellow notice in the Investment block. If it's there, it's a read failing. |
| The Forms KPI disappeared | It only shows up when it's greater than zero. | Nothing to do. It comes back on its own when the first form lead comes in. |
| The Site traffic & organic Google block doesn't show up | There's no Google Analytics or Search Console connected. | Connect one of the two tools on your account. |
| The Market research (Atlas) block doesn't show up | Atlas hasn't researched your market yet. | Ask Atlas in the chat on the Home tab to research your competitors. |
| "No report generated yet" | No report has been written or saved so far. | Click Generate report now. |
| "You requested the report several times in a row…" | You clicked Generate report now repeatedly. | Wait a few moments. The report is already being prepared. |
| "Couldn't generate the report" | Failure at the time of writing the report. | Try again in a few minutes. |
| "Couldn't save" on the Settings tab | Failure while recording the target or the note. | Click Save again. |
| Nina says on the panel "Your dashboard has no goal yet" | The Target contacts/day field is blank or zero. | Go to the Settings tab and fill in the target. |